Population microdata are key input to estimate and map population in the absence of a complete and recent census (Wardrop et al. 2018). D. R. Leasure et al. (2020) developed a hierarchical Bayesian modelling framework combining pre-survey household listing with geospatial covariates to predict population count with high spatial resolution.
In settings where household listings are not available, Boo et al. (2019) carried out a microcensus survey, that is a household survey in well-defined small clusters aiming at enumerating the resident population.
Household surveys are expensive exercises and operational data such as household pre-listings are often not accessible because not deemed worth cleaning, pseudonymising, or even storing.
To overcome those limitations in accessing population microdata, D. Leasure, Tatem, and Bondarenko (2020) developed a Bayesian model with the Integrated Public Use Microdata Series-International (Ruggles et al. 2003), that is a 10% sample of individual data from censuses, combined with building footprints (Ecopia.AI and Maxar Technologies 2019) and national projections (Raftery, Alkema, and Gerland 2014).
There is another source for population microdata that is available upon simple request: the Demographic and Health Surveys (Corsi et al. 2012).
In this blog post, we explore the availability of both data sets across time and country.
We copy/pasted available datasets from the download website page of both institutions as well as a table linking countries to their continent and we stored them here:
If you want to access the code just fold out this block:
hide
library(tidyverse)
library(ggplot2)
library(kableExtra)

continent <- read_csv('data/continent_country.csv')
ipums <- read_csv( 'data/ipums_samples_date.csv')
dhs <- read_csv('data/dhs_samples_date.csv')

# DHS metadata cleaning

dhs_cleaned <- dhs %>%
  rowwise() %>%
  mutate(
    Survey =  str_remove(Survey, " \\(.+\\)"),
    country = str_remove(Survey, " \\d+\\-*\\d*+"),
    year = str_split(Survey, " ")[[1]][length(str_split(Survey, " ")[[1]])],
    year = ifelse(grepl("-", year), paste0(str_sub(year,1,2), str_sub(year, -2,-1)), year),
    source = 'dhs'
  ) %>%
  select(-Survey, -`GPS Datasets`)

# IPUMS metadata formatting
ipums_cleaned <- ipums %>%
      pivot_longer(-country, values_to = 'year') %>%
      select(-name) %>%
      filter(!is.na(year)) %>%
      mutate(source = 'ipums')

# Build master dataset for visualising
master <- rbind( ipums_cleaned, dhs_cleaned) %>%
  ungroup() %>%
  # assign continent to countries
  left_join(
    continent
  ) %>%
  # prepare variable for plotting
  mutate(
    country_f = fct_reorder(country, continent),
    year_label= paste0(str_sub(year, 1,3), "0")) %>%
  filter(!is.na(continent)& year_label>=1960)

# Plot data

year_label <- unique(master$year_label)

ggplot(master , aes(x=year, y=country_f,  color=source))+
  geom_line()+
  geom_point()+
  # replace individual year by grouped year
  scale_x_discrete(breaks=year_label, labels=year_label)+
  # remove coutnry names
  scale_y_discrete(breaks=NULL, name='')+
  # use faceting to group country by continent
  facet_grid(rows = vars(continent), scales = "free_y", switch='y', space = "free_y") +
  theme_minimal()+
  theme(panel.spacing = unit(0, "lines"),
        strip.background = element_blank(),
        strip.placement = "outside",
        strip.text.y.left = element_text(angle = 0))+
  labs(title= 'Dates of available DHS and IPUMS data for every country')+
  scale_colour_manual(values=c( "seagreen4", "orchid1"))
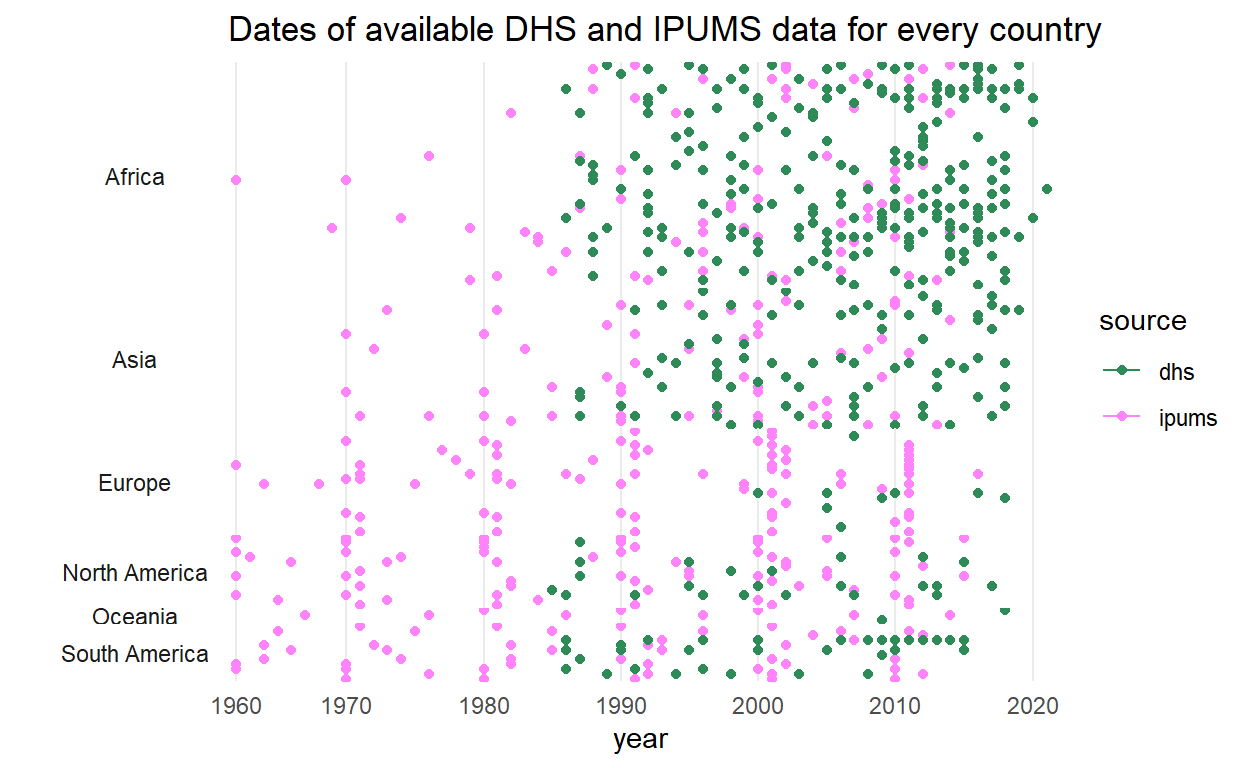
Low and middle income countries are concentrated in Africa, Asia and South America, where we see less data avaialble through IPUMS and more regular data from DHS.