woprVision: a shiny app to visualise Bayesian predictions
I helped develop woprVision, a multilingual interacive application to visualise and retrieve Bayesian population estimates. We use woprVision at WorldPop as part of our data release process to support (1) mean estimates spatial aggregation for people with limited GIS-skills (2) full distribution aggregation for coomputing correct credible intervals.
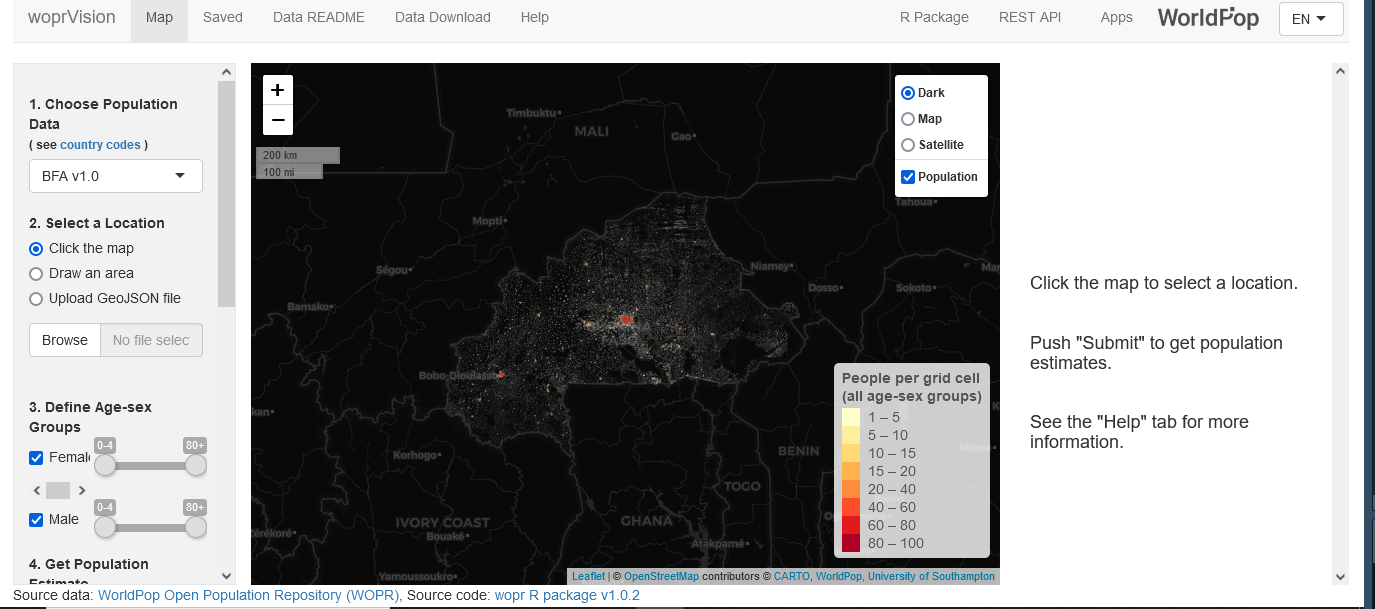
woprVision is an R shiny application that allows you to browse an interactive map to get population estimates for specific locations and demographic groups. It is
It has been developed for three reasons:
visualization of newly released population datasets
easy interaction with gridded population for people with limited GIS skills through (1) a drawing function, (2) a geojson upload function.
computation of adequate credible intervals for spatial aggregates from the full posterior distribution
woprVision is available online at https://apps.worldpop.org/woprVision.
Its source code is hosted here: https://github.com/wpgp/wopr
If run with local files, woprVision requires a SQLlite database with population prediction distribution for every grid cell and a tiled image of the gridded population.
Online, it runs on a shiny server and pings the WorldPop API.
Citation
For attribution, please cite this work as
Darin (2021, June 10). Meet Edith: woprVision: a shiny app to visualise Bayesian predictions. Retrieved from https://edarin.github.io/thatsme/posts/2021-08-01-woprvision/
BibTeX citation
@misc{darin2021woprvision:,
  author = {Darin, Edith},
  title = {Meet Edith: woprVision: a shiny app to visualise Bayesian predictions},
  url = {https://edarin.github.io/thatsme/posts/2021-08-01-woprvision/},
  year = {2021}
}